Botoronga - Temperature Monitor in SP

Bot that posts daily updates with temperature variation graphs in São Paulo

Temperature graph for São Paulo

Current temperature in São Paulo with available data updated to the moment

About Botoronga

Botoronga is an automated system that monitors and publishes daily temperature variations in São Paulo city, with informative graphs and community interactions.

Main Features:

Technologies Used:

Python Selenium Matplotlib Tweepy Bluesky API OpenWeatherMap API

How It Works

Data Collection and Processing Flow:

  1. Data Collection: Accesses weather sources to obtain historical temperature data
  2. Processing:
    • Converts temperatures from Fahrenheit to Celsius
    • Groups data by hour
    • Applies smoothing filter for better visualization
  3. Graph Generation: Creates visualization with Matplotlib including:
    • Title with current date
    • Clearly marked axes
    • Grid for easy reading
  4. Current Temperature: Queries OpenWeatherMap API to get temperature at posting time
  5. Publishing: Sends the graph and information to Twitter/X and Bluesky

Automated Interaction:

Output Example

Typical Post:

Current temperature in São Paulo: 22.5°C

#TemperatureSP #Weather #SãoPaulo

Temperature variation throughout the day:

Graph example

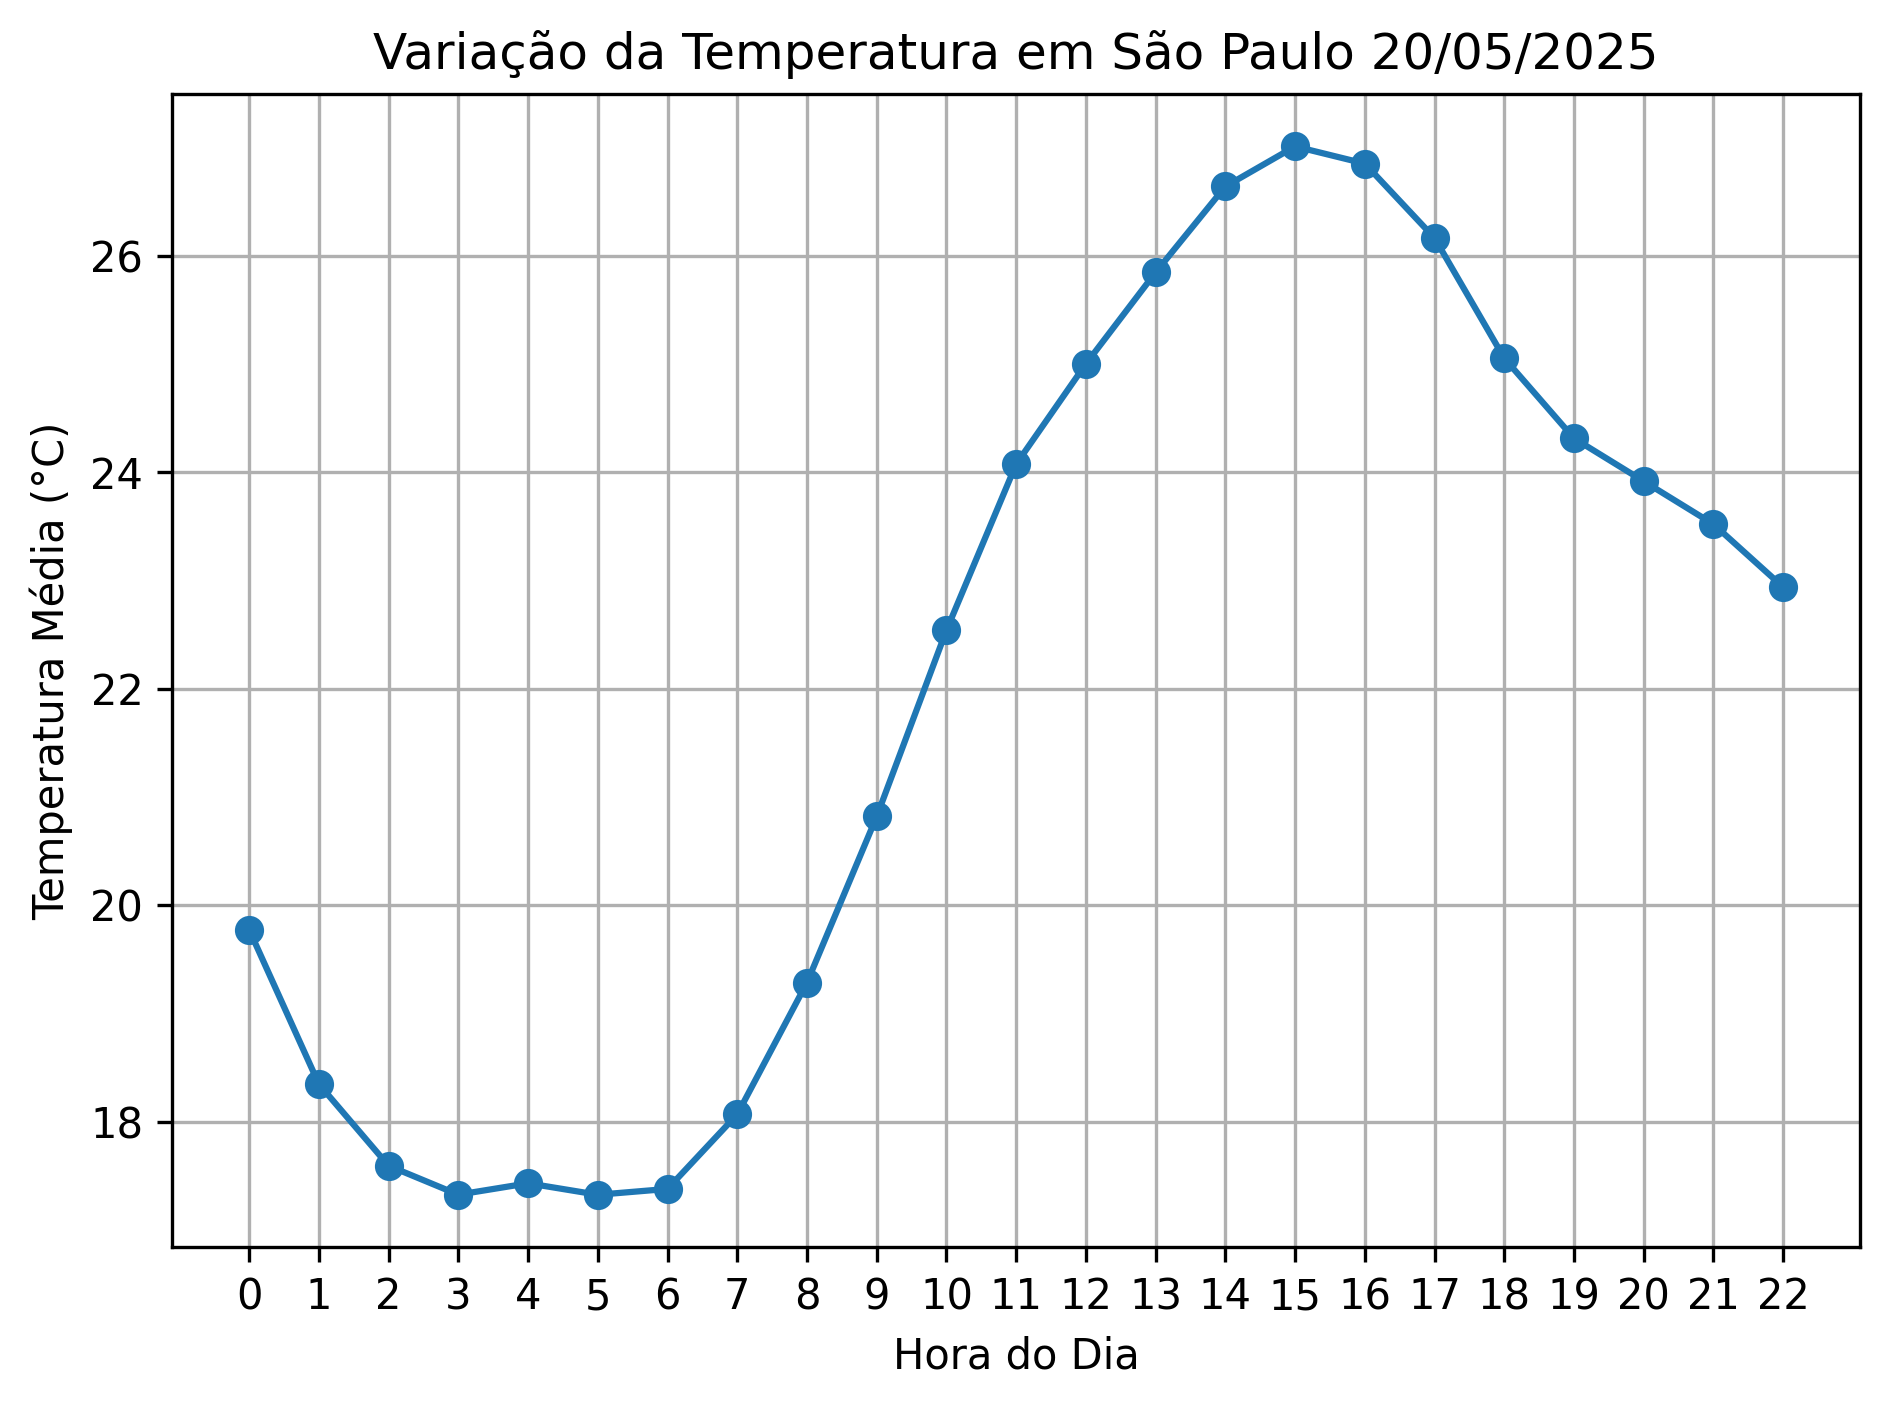
Temperature variation graph for an entire day in São Paulo with smoothed data

Monitoring and Control

Botoronga includes advanced systems to ensure continuous operation within platform limits:

View on Twitter/X View on Bluesky